de vita sua
a blog
The Temples Database: Outline of a Lesson Plan
by John D. Muccigrosso
I’ve had this in the back of my mind, but last week’s daylong conference at NYU’s ISAW, “Digital Approaches to Teaching the Ancient Mediterranean,” got me to sit down to write up a lesson plan related to my Classical World temples database. You can check out the conference-related Tweets here, but as the name suggests, the event dealt with the more pedagogical side of what often appears as our research work.
I’m going to outline here one possible use of our data, split into two versions: one for the students with some programming or spreadsheet-based chops, and another for those without.
Changes in Roman Religious Practice
Roman religious practice often gets treated as if it were a monolithic thing that didn’t evolve over time. That’s wrong, of course. Nothing stays static over a millennium (give or take: ~500 BCE to ~500 CE). So how can a database of Classical World temples show that? Well, at least one of the features tracked in the database pretty clearly changes with time: the nature of the dedicatee of the temple. Here’s an outline of two methods to explore that…
For Instructors
I’m going to be purposefully vague in what follows. Depending on the knowledge and experience of your students (or you!), you’ll want to give them different and more or less specific instructions. You might even want to simply use the map yourself in class and ask your students what they observe as you go through the centuries (I’ve done this). If you’ve got a savvier group, you can use this lesson to practice CLI skills by accessing APIs with curl. Students can also work with the GeoJSON version of the data they get from GitHub instead of the CSV. They can experiment with the best way to visually show the data (besides the built-in map) and use various apps to do that (R, OpenOffice, Excel). They can look at the structure of the database to see what other things look interesting.
If you do use the database in any way, I’d love to hear about it! You can find me on Twitter or a few other ways that are linked off to the left of every post. If you’d like your students to contribute to the temples project, I’m game for that, too. Get in touch!
For the tech-savvy student
The data are directly accessible via an API or via GitHub.
We’re going to look at the temples that are found only in the city of Rome (which is, of course, in Italy), so use the API to download just those temples, or load the data into a spreadsheet and select only those records.
If you look at the structure of the data, you’ll see that there’s a category for the nature of the dedicatee and that there are a few fields that relate to the foundation dates of the temples. Some are more precise than others. Pick some version of the date that you can work with. Now generate statistics or charts based on those dates that show the nature of the deity and its evolution over time.
For the less savvy
The database can be viewed on a lovely map with little effort on the part of the user. Go to the map and select the “Zoom to Rome” at the top left. That will—unsurprisingly—zoom the map so that it shows the city of Rome.
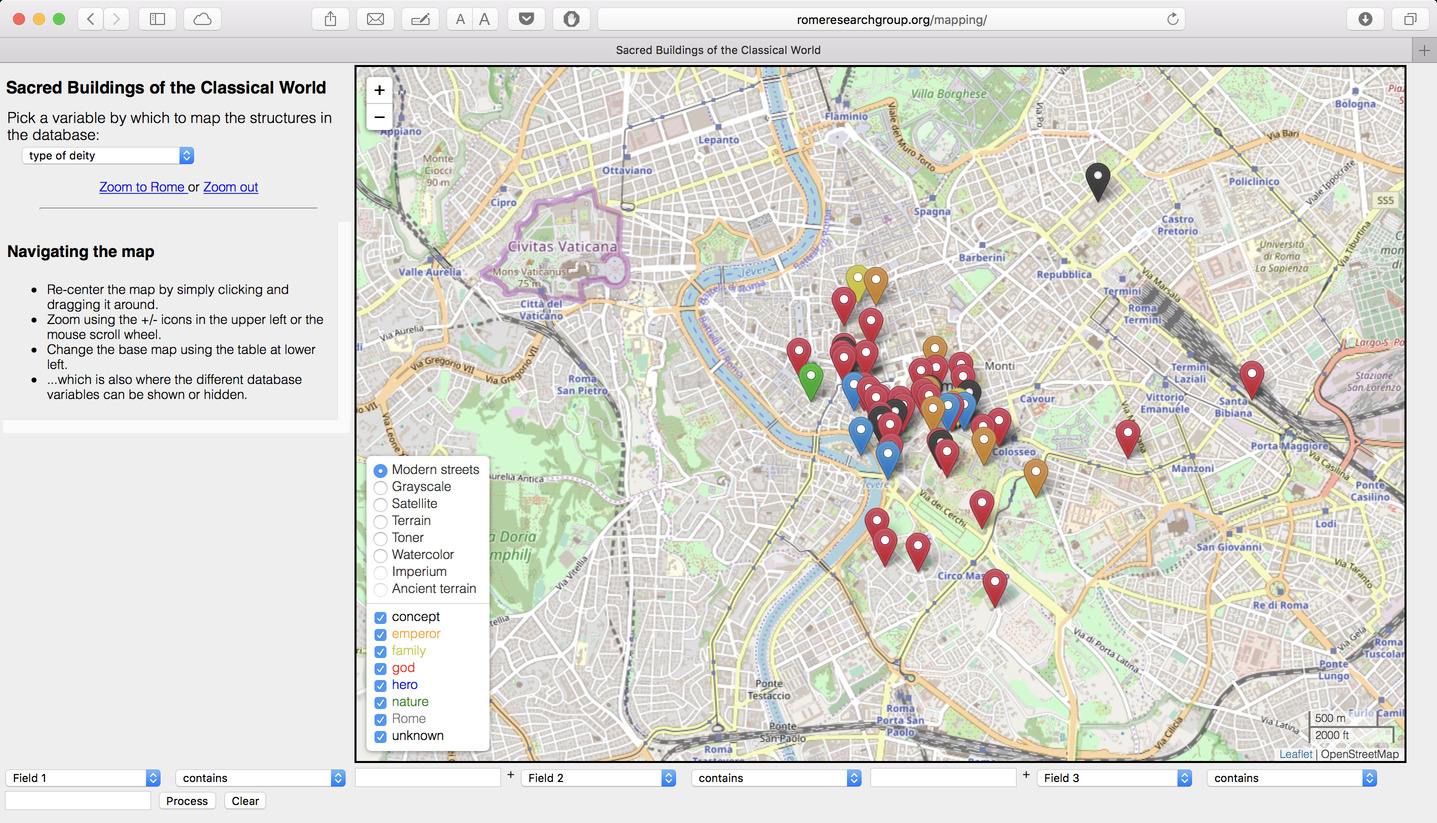
Next we want to view the locations of the temples using markers with different colors to indicate the different kinds of deities the temples were dedicated to (using “deity” somewhat flexibly here). Use the drop-down menu at the upper left to select “type of deity”. That should get you a map with a bunch of prettily colored markers, like the one in the figure.

(Image by John D. Muccigrosso CC BY-NC-SA 4.0)
Finally use the menus at the bottom of the screen to look at the data one century at a time. To do this, choose “century” in the first menu, then put numbers into the related text box, starting with -6 (for 6th c. BCE) and ending with some small positive number.
For everyone
Now that you’ve looked at the data, what changes or trends do you see? Can you connect those changes or trends to any historical changes or trends that you know about?
Tags - technology - teaching - temples