de vita sua
a blog
DHSI - Summer DH
by John D. Muccigrosso
Last summer (I know, it’s been a while) Drew University hosted its fourth round of summer DH work under the auspices of a grant from the Mellon Foundation. We call it the DH Summer Institute, modeled a bit on our long-running Drew Summer Science Institute (“DSSI”), and featuring, as DSSI does, students working on teams led by faculty to advance DH projects of various kinds. I participated back in the first, trial-run year (2016, when work started in earnest on the Temples of the Classical World database (TCW)) and then again in the first year of the grant (2018). Drew’s media team did a nice piece on last summer’s edition, but I wanted to go into a little detail on our projects here.
I had two great students to work with this year, though unfortunately we had to do it all on-line due to concerns about COVID. The idea behind our work was to begin to get into digital format some of the data in Lily Ross Taylor’s magisterial The voting districts of the Roman Republic: the thirty-five urban and rural tribes. The University of Michigan Press started work on a re-edition back in the late 1990s when I was a grad student at Michigan and the department’s resident computer geek, so I had a few conversations with them about how to handle the big fold-out maps Taylor had included. These were early days for the internet and in the end, they scanned the maps, keeping the original red highlight color, which was certainly better than nothing and not that easy, as I recall, because the big fold-out maps were all they had, not the originals. I think the maps turned out well (if you have the digital version of that edition, you can see what I mean), but they’re not terribly re-usable in terms of the data they contain, which leads to this part of our work this summer.1
What got done
After some preliminary work on various text-based file formats and how to use the command line (which ended up being less useful than I thought!), the students took on two separate tasks, both related to mapping.
Mapping
Katie Higgins, a Classics minor with one semester left to graduation, jumped in on creating a digital map of the course of the Aurelian walls. This was admittedly a bit of a side project, but one that let Katie learn about some of the great mapping tools that are out there. She started out on geojson.io which lets you add points, lines, and shapes to a map of the earth, all the while creating the geojson for you on the fly. When you’re done, you can copy or save the geojson and use that wherever you want. It’ll also work in reverse and map valid geojson that you provide it. In short it’s a quick and dirty way to go quickly from the text to the map, or vice versa (assuming you’ve got the geojson).
It’s not so easy to modify the features you put on the map (to my knowledge), but fortunately we found another site that does just that: vector.rocks. Through a fairly intuitive interface, you can modify all the features you put on a map, and then save the new geojson. Katie used the satellite view on this site to manually trace the outline of the extant portions of the Aurelian Wall and then used some written sources to fill in the no longer extant or visible stretches. She went the extra mile and added in the towers, where they were visible. I’m not aware of another digital version of these walls, so this is a great resource. I’ve already added the geojson to TCW where you can toggle it on and off.
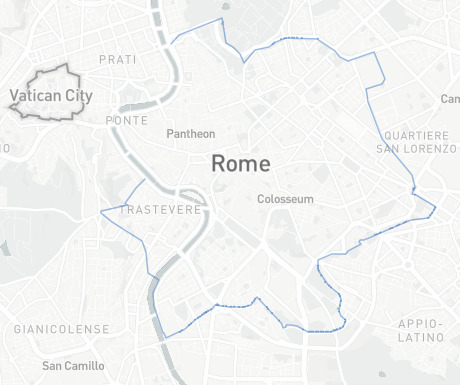
(Image by John D. Muccigrosso CC BY-NC-SA 4.0)
Katie then moved on to Taylor’s maps in VDRR. This time she took on the maps that Taylor used to indicate the rough borders of the early tribes. For this project, Katie used vector.rocks as before, but added in Map Warper, which lets you upload and then rectify any map against the “real” map. Katie ended up doing both Taylor’s map of the 17 earliest tribes, including the roads and rivers that were on there, and the map of the 31 rural tribes. Taylor’s labels aren’t included, so that might be something for the future, though that’s going to require more information on which towns and cities belonged to which tribes, since Taylor didn’t provide lines to indicate tribal borders.
And that nicely brings us to the work of the other student, Emma Bryer, a first-year Classics major.
Text to data
Emma took on the task of converting to a data format Taylor’s very textual lists that assigned ancient places and peoples to Roman tribes. She linked those places to Pleiades places and then used the Pleiades location data to create maps. Like Katie, Emma put her data into GitHub, but she also created some nice visualizations using a Google site that pulls the geographic data directly from her repo. Emma slices the data in a variety of ways on the site. I’ve put one of my favorites in the image: a color-coded version of place by tribal assignment. It’s a bit of a mess…as are the data!
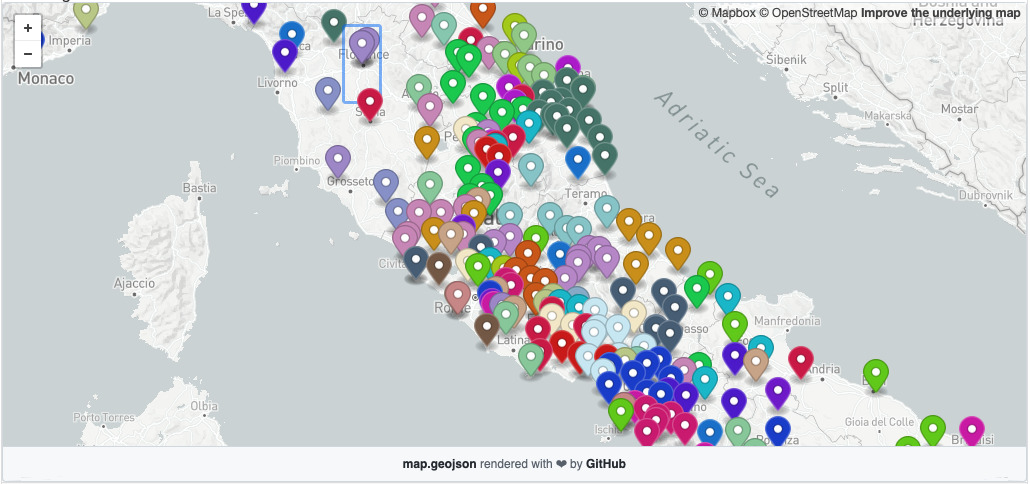
(Image by John D. Muccigrosso CC BY-NC-SA 4.0)
The Future
Emma mapped Taylor’s data, but they’re a bit out of date now, so the next step involves updating them with recent discoveries. It would also be interesting to use the data to generate our own versions of Taylor’s map of the tribal territories (that Katie worked on). Can we use something like Voronoi tessellation or Thiessen polygons, along with some information on geographical features, like rivers and mountains, to programatically generate these areas?
More to come!
-
One of the great benefits of that re-edition was Jerzy Linderski’s epilogue, which updated the book with a lot of information on the tribes that had emerged since the original 1960 publication. ↩
Tags - classics - DH - history - Drew_University - Rome