de vita sua
a blog
Spreadsheet to GeoJSON: Part 2, in which I do not re-invent the wheel
by John D. Muccigrosso
My last post was about doing a simple, but automated conversion of our growing Google sheet of Roman temples into GeoJSON. At the end, I noted that there were some existing methods for doing that, and in the interim I’ve been exploring those a bit.Most of them involve some kind of javascript and are designed for use on websites (or with node). That’s pretty nice in some circumstances, and in fact I’ve been playing around with them, trying to improve my leaflet.js skills in the process.
However I’m still interested in being able to download our data and convert all of it to GeoJSON which gets posted to GitHub, for which javascript isn’t ideal (and I think I could make it work, if I knew js better), but there is some software out there that means I don’t have to worry about the actual conversion from sheet to json, though I do have to do some clean up. Ideally the script will not require any interaction, and it will convert all the data we have into GeoJSON, not just the bits that I tell it about. This will let us add and delete columns in the sheet without worrying about whether it will screw up the conversion.
The Details
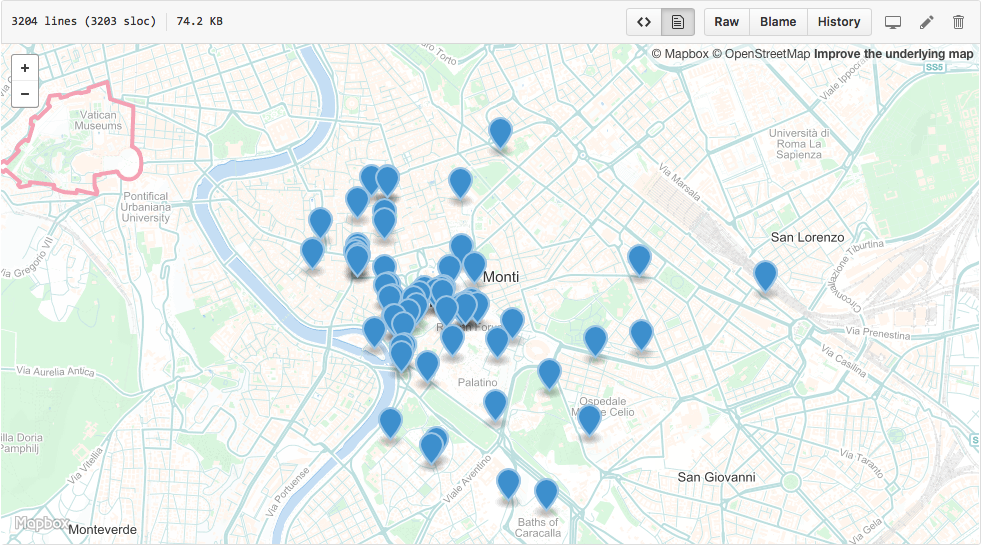 |
| Temples and mithraea mapped in the area of Rome. |
- Download the sheet from Google as xml:
https://spreadsheets.google.com/feeds/list/key/1/public/values, wherekey
is the key for the sheet. Pretty sure that I can get csv if I authenticate to Google, but I couldn’t figure out how to do that in a timely way, so I stuck with the public feed. When I tried to download those versions via the browser, it did work, likely because I’m logged into Google services all the time, but possibly because Google doesn’t like people usingcurlto get data, but will allow a real browser to. In either case, I didn’t want to have to rely on the browser for this, so I stuck with what I could get via the command line. - Reformat and clean up the xml with
tidy -xml -iqand thensed 's/gsx://g'. (Google really likes thosegsx
prefixes on the field names.) - Use ogr2ogr to convert the xml to csv. ogr2ogr seems to need files to work on, so at this point I also stored the data in temporary files. (Happy to be wrong about the necessity for files, so let me know!)
- Now use ogr2ogr again, the time to convert the csv to GeoJSON. You’d think I could convert the xml directly to GeoJSON, but, again, I couldn’t figure that out (.vrt files) and so resorted to the double conversion. Help welcome!
- At this point, I do a little more clean up, getting rid of some fields from the xml that I don’t want (via grep, jq, and perl) and removing the false 0,0 coordinates that get generated instead of null when the sheet cells for longitude and latitude are empty.
- Finally I save the resultant file to my GitHub sync folder. I also generate a version that has only entries with coordinates, which can be mapped without complaints. That last is handled with jq and tr.
As usual the script is up on GitHub, where it’s annotated with more detail, and you can see the resultant map up there too (the area around Rome is shown in the image up above).
Tags - DH - Google - technology - temples